Debugging Using GDB/LLDB
This article shows you how to debug on your virtual device using GDB/LLDB protocol.
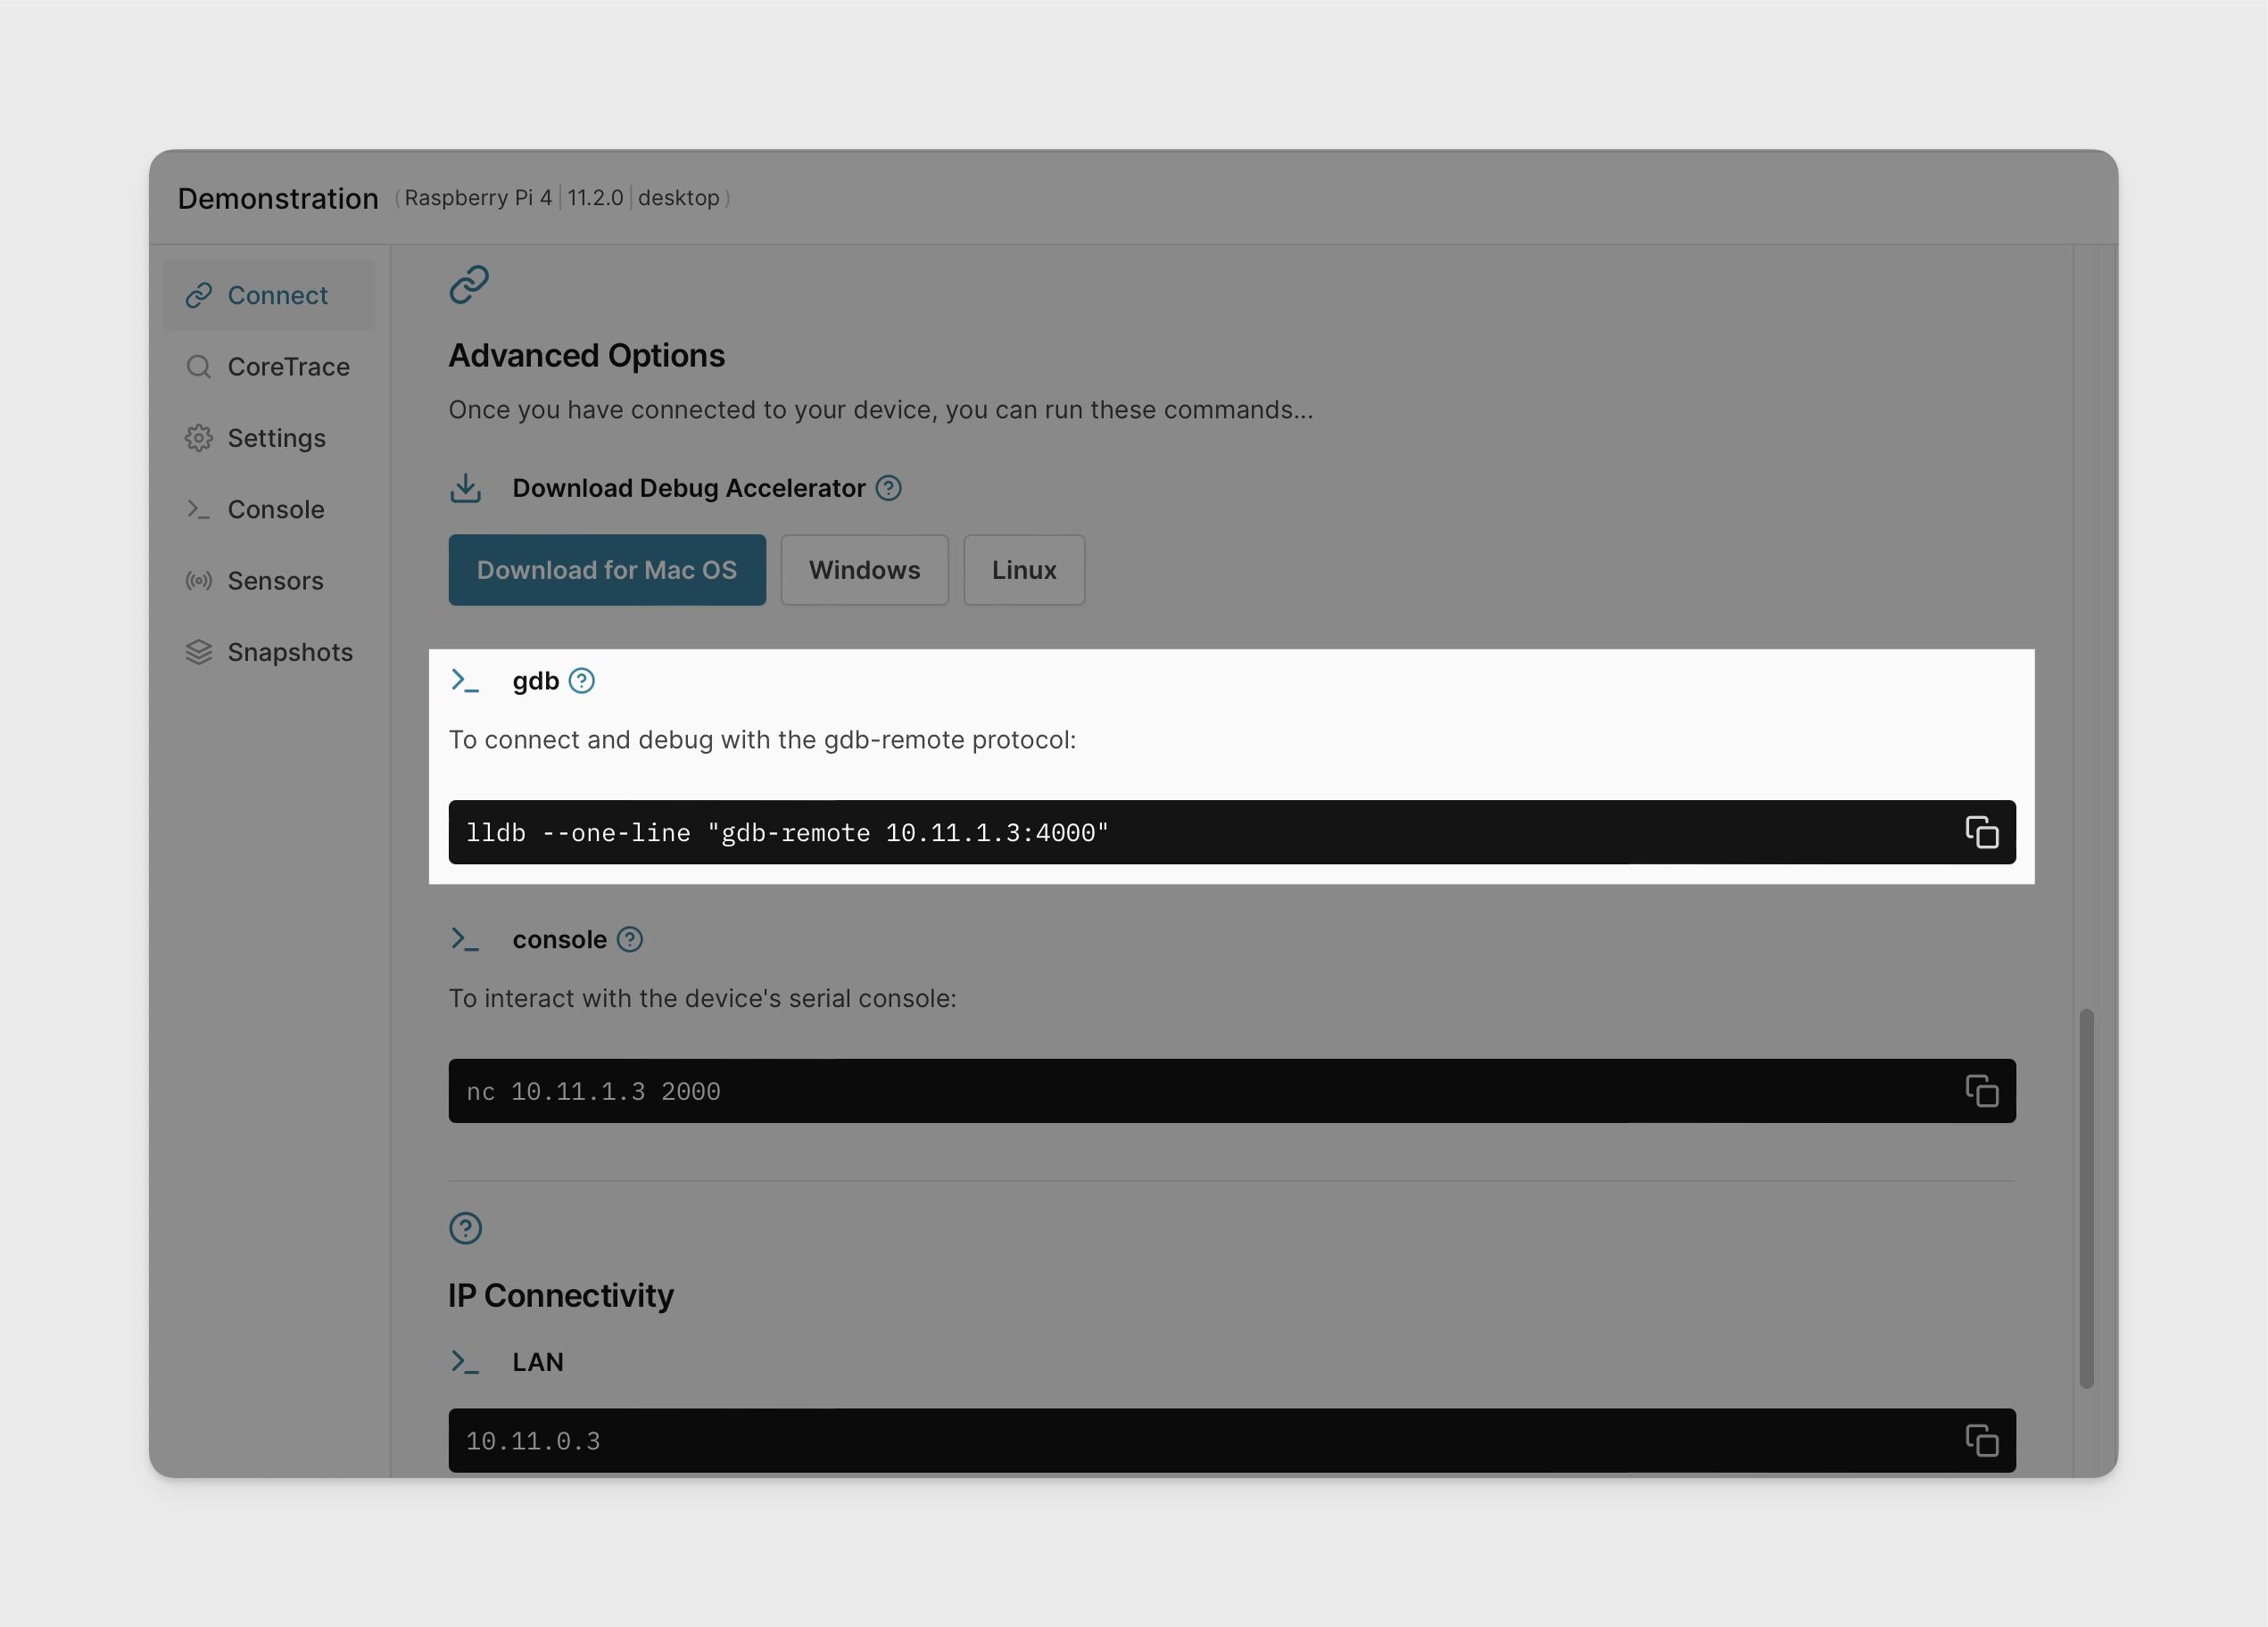
After creating a VM, the Connect tab provides an lldb one-liner that can be used to establish a debugging session with the VM.
While lldb is specified in the UI, users are free to use gdb as well.
$ gdb
(gdb) target remote 10.11.1.1:4000
Remote debugging using 10.11.1.1:4000
0xffff80001117094c in ?? ()
(gdb) info reg
x0             0xe0     224
x1             0x11c430 1164336
x2             0x0      0
x3             0x4000000000000000       4611686018427387904
x4             0x0      0
x5             0xffff8000dde56000       -140733765558272
x6             0x80     128
...
(gdb) x/10i $pc
=> 0xffff80001117094c:  hint    #0x1d
   0xffff800011170950:  ret
   0xffff800011170954:  hint    #0x19
   0xffff800011170958:  stp     x29, x30, [sp,#-16]!
   0xffff80001117095c:  mov     x29, sp
   0xffff800011170960:  bl      0xffff800011170940
   0xffff800011170964:  ldp     x29, x30, [sp],#16
   0xffff800011170968:  hint    #0x1d
   0xffff80001117096c:  ret
   0xffff800011170970:  hint    #0x19
All the usual debugger features work, including single-step, breakpoints, watchpoints, memory inspection, register inspection, register or memory editing, etc. Consult a guide specific to your debugger. Note that debug is operating in "system mode" or "kernel model" similar to how debuggers operate when connected remotely to a kernel or to a JTAG interface rather than in the default "application mode" of operation when GDB / LLDB are run on a local application or when connecting to a gdb remote server for application debug.
Breakpoint Acceleration and Limitations
Atlas provides debug capabilities to debug applications (LLDB/GDB) via the gdb-remote protocol. The gdb-remote protocol enables the client to set both hardware breakpoints using the hbreak command and software breakpoints using the break command. Internally Atlas leverages the, currently 4, hardware breakpoints provided per host core by the execution host to accelerate both types of breakpoints. Additionally Atlas provides an unlimited number of software breakpoints. However these software breakpoints have several limitations that cause operation to differ based on the target architecture.
Operation of Software Breakpoints on 32-bit Cores (Cortex-M)
All breakpoints operate as expected. Breakpoints beyond the first 4 are slower though this may not be observable as the slowdown is generally lower than network latency.
Operation of Software Breakpoints on 64-bit Cores (Cortex-R and Cortex-A)
The first 4 breakpoints generally operate as expected. Attempting to set additional hardware breakpoints set using the hbreak command will fail with a 'failed to set breakpoint X' message where X is the number of the breakpoint. Additional software breakpoints set using the break command depend on the address type and the configuration of the Atlas debug server set using the brconf monitor (mon) command:
(gdb) mon brconf
Usage:
  brconf info                                Print current config
  brconf allow-ttbr0-swbreak [0|1]           Control for 64bit usermode software breakpoints
  brconf allow-ttbr1-swbreak [0|1]           Control for 64bit kernelmode software breakpoints
(gdb) mon brconf info
  max-hwbreak                4
  allow-ttbr0-swbreak        0
  allow-ttbr1-swbreak        1
The mon brconf info command reports the max count of hardware breakpoints as a read-only field, currently 4 for all deployed host types. The allow-ttbr0-swbreak control allows users to enable the server to set software breakpoints in 64bit user mode, the default is 0 which disables setting software breakpoints on user mode code. The allow-ttbr1-swbreak control, which defaults to 1 allows the user to disable the server from setting software breakpoints in kernel code.
When a software breakpoint control is set to 0 the next call to break will fail with a 'failed to set breakpoint X' message. When allow-ttbr1-swbreak is set to 1, the default, additional calls to break with an address in kernel space, generally addresses over 2^63, will succeed and the breakpoint will operate as expected, though with a generally unobservable slowdown vs hardware breakpoints. When allow-ttbr0-swbreak is set to 1, not default, additional calls to break with an address in user space, generally addresses less than 2^63, will succeed and the breakpoint will operate as expected until the kernel decides to modify the virtual address space, for example by swapping in or out a region of memory. While operation is as deterministic as the target OS kernel scheduling algorithms, operation of breakpoints after a modification to the virtual address space is unlikely to be predictable or useful so extreme care should be taken before setting allow-ttbr0-swbreak to 1.
More specifically:
- HARDWARE BREAKPOINTS
hbreakin kernel code -> works, up to brconf.max-hwbreakhbreakin user code -> works, up to brconf.max-hwbreak
- SOFTWARE BREAKPOINTS
brconf allow-ttbr1-swbreak 0breakin kernel code -> implicitly promoted to hardware breakpoints, up to brconf.max-hwbreak
brconf allow-ttbr1-swbreak 1(default)breakin kernel code -> works, effectively unlimited quantity
brconf allow-ttbr0-swbreak 0(default)breakin user code -> implicitly promoted to hardware breakpoints, up to brconf.max-hwbreak
brconf allow-ttbr0-swbreak 1breakin user code -> works as expected until the kernel modifies the virtual address space, effectively unlimited quantity
Monitor Commands
Monitor commands are interpreted directly by the debug server and not by the client (or marshaled into any known command format). In other words, the monitor is a convenient way to expand a debugger's functionality without changing the client code. gdb exposes this functionality by prefixing your command with monitor. Sending e.g. monitor help requests that Arm Virtual Hardware responds with its list of available commands.
(gdb) monitor help
Available monitor commands:
  help                  List all commands.
  info                  Show VM information.
  sr                    Access CPU system registers.
  pt                    Dump current pagetable.
  v2p                   Translate a virtual address to physical.
  p2v                   Translate a physical address to virtual.
  vcont-dflt            Apply default vCont action if specific actions are present.
  phys                  Switch to physical access mode (optionally takes base address).
  virt                  Switch to virtual access mode.
  bt                    Show iOS-style backtrace.
  thread                Show current thread.
To list the contents of the system registers one may use monitor sr.
(gdb) monitor sr
System registers of CPU 0:
  sctlr_el1        = 0x0000000030d4d91d
  cpacr_el1        = 0x0000000000300000
  zcr_el1          = 0x0000000000000000
  ttbr0_el1        = 0x00000001061c5000
  ttbr1_el1        = 0x0188000041859000
  tcr_el1          = 0x00000032b5503510
...
Or list the current configuration of the page tables of the current virtual CPU (vCPU).
(gdb) monitor pt
Pagetable for CPU 0:
  0000004000000000-0000004000000fff -> 010a022000 local user pXN uXN memory Owb-rwa Iwb-rwa
  0000004000001000-0000004000001fff -> 010a0d9000 local user pXN uXN memory Owb-rwa Iwb-rwa
  0000004000002000-0000004000002fff -> 010a023000 local user pXN uXN memory Owb-rwa Iwb-rwa
  0000004000008000-0000004000008fff -> 0108871000 local user pXN uXN memory Owb-rwa Iwb-rwa
  0000004000009000-0000004000009fff -> 0108741000 local user pXN uXN memory Owb-rwa Iwb-rwa
  000000400000a000-000000400000afff -> 010a1db000 local user pXN uXN memory Owb-rwa Iwb-rwa
...
lldb can be used similarly to send monitor commands using a slightly more verbose command structure.
$ lldb --one-line "gdb-remote 10.11.1.1:4000"
(lldb) gdb-remote 10.11.1.1:4000
Process 1 stopped
* thread #1, stop reason = signal SIGINT
    frame #0: 0xffffffe01117094c
Target 0: (No executable module.) stopped.
(lldb) process plugin packet monitor help
Available monitor commands:
  help                  List all commands.
  info                  Show VM information.
  sr                    Access CPU system registers.
...
Debugger threads are discrete VM CPUs, and so switching between threads allows users to interact with specific cores.